Company Dashboard
What is the Company Dashboard?
Section titled “What is the Company Dashboard?”The Company Dashboard gives managers and the whole team a single, always-on view of how the business is tracking — showing performance metrics, goal progress, and an overview of quote and job activity for your workspace.
Where to find it
Section titled “Where to find it”Click Dashboard in the sidebar.
Opening the dashboard
Section titled “Opening the dashboard”-
Click Dashboard in the sidebar.
-
The dashboard opens showing your workspace’s key metrics and goal widgets.
-
Use the date frame picker inside each board to adjust the time period shown.
What you’ll see
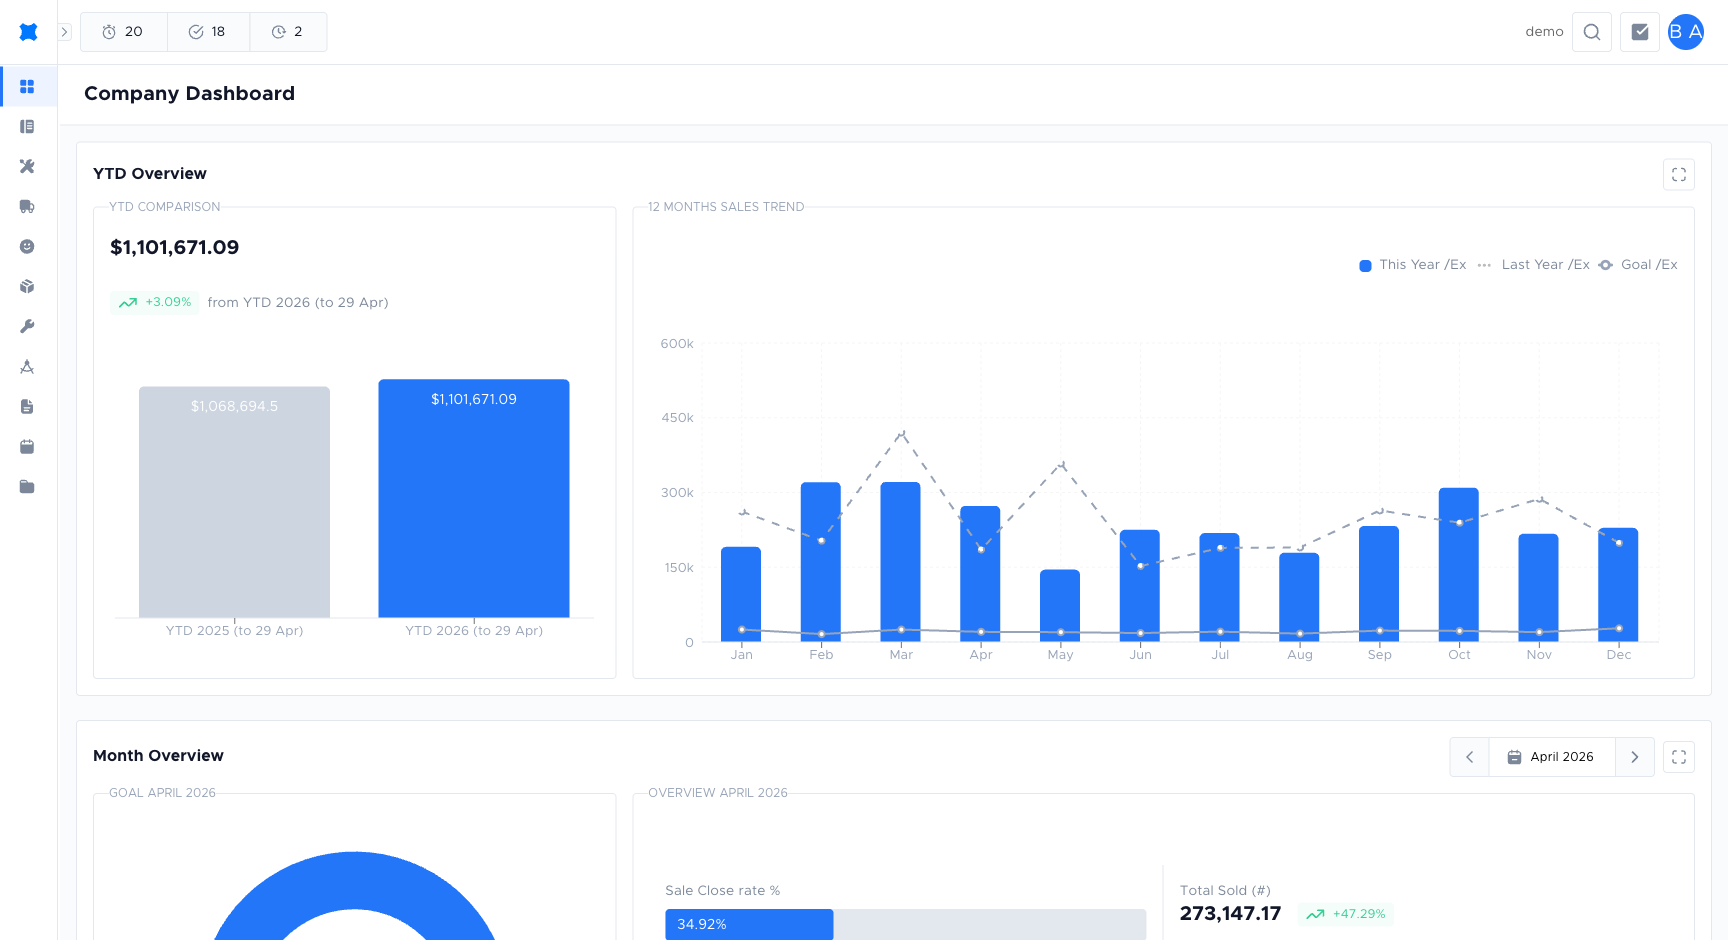
Section titled “What you’ll see”The dashboard is laid out as a grid of widgets. Each one is described on the Widgets page:
- Summary Figures — total sold value, year-to-date sold, and open pipeline.
- Monthly Goal — progress chart showing how close the workspace is to its company-wide monthly revenue target (rolled up from every business unit). See Sales Goals to set up or adjust each business unit’s contribution.
- Month Sold Comparison — this month’s sold value compared to the same month last year.
- YTD Sold Comparison — year-to-date sold vs the previous year.
- Monthly Sold Trend — a 12-month rolling chart of approved sold value.
- Marketing Table Board — lead sources with quote counts, sold totals, and conversion rates.
“Sold” values come from quote options with an Approved status.
Who sees it
Section titled “Who sees it”Any user with access to the Company Dashboard can view it. Figures respect your business-unit permissions — users who can only see a subset of business units see the corresponding subset of widgets.
Frequently asked questions
Section titled “Frequently asked questions”Why is the dashboard showing different numbers to last week?
The dashboard uses a date range that resets on each visit. Select the same date range you used before to compare figures.
Can I share the dashboard with someone who doesn’t have a brix login?
No, the dashboard is only accessible to users with a brix account. You can take a screenshot to share figures externally.
Can I customise which widgets appear?
The widgets on the dashboard are fixed. Contact support if you need a widget added or removed for your workspace.
Things to check
Section titled “Things to check”Dashboard figures look wrong
Check the selected date range. The default period may not match what you expect.
Dashboard is loading slowly
A large number of quotes and jobs in your workspace can slow the dashboard. Contact support if this persists.