Score Card and Wallboard
Score card
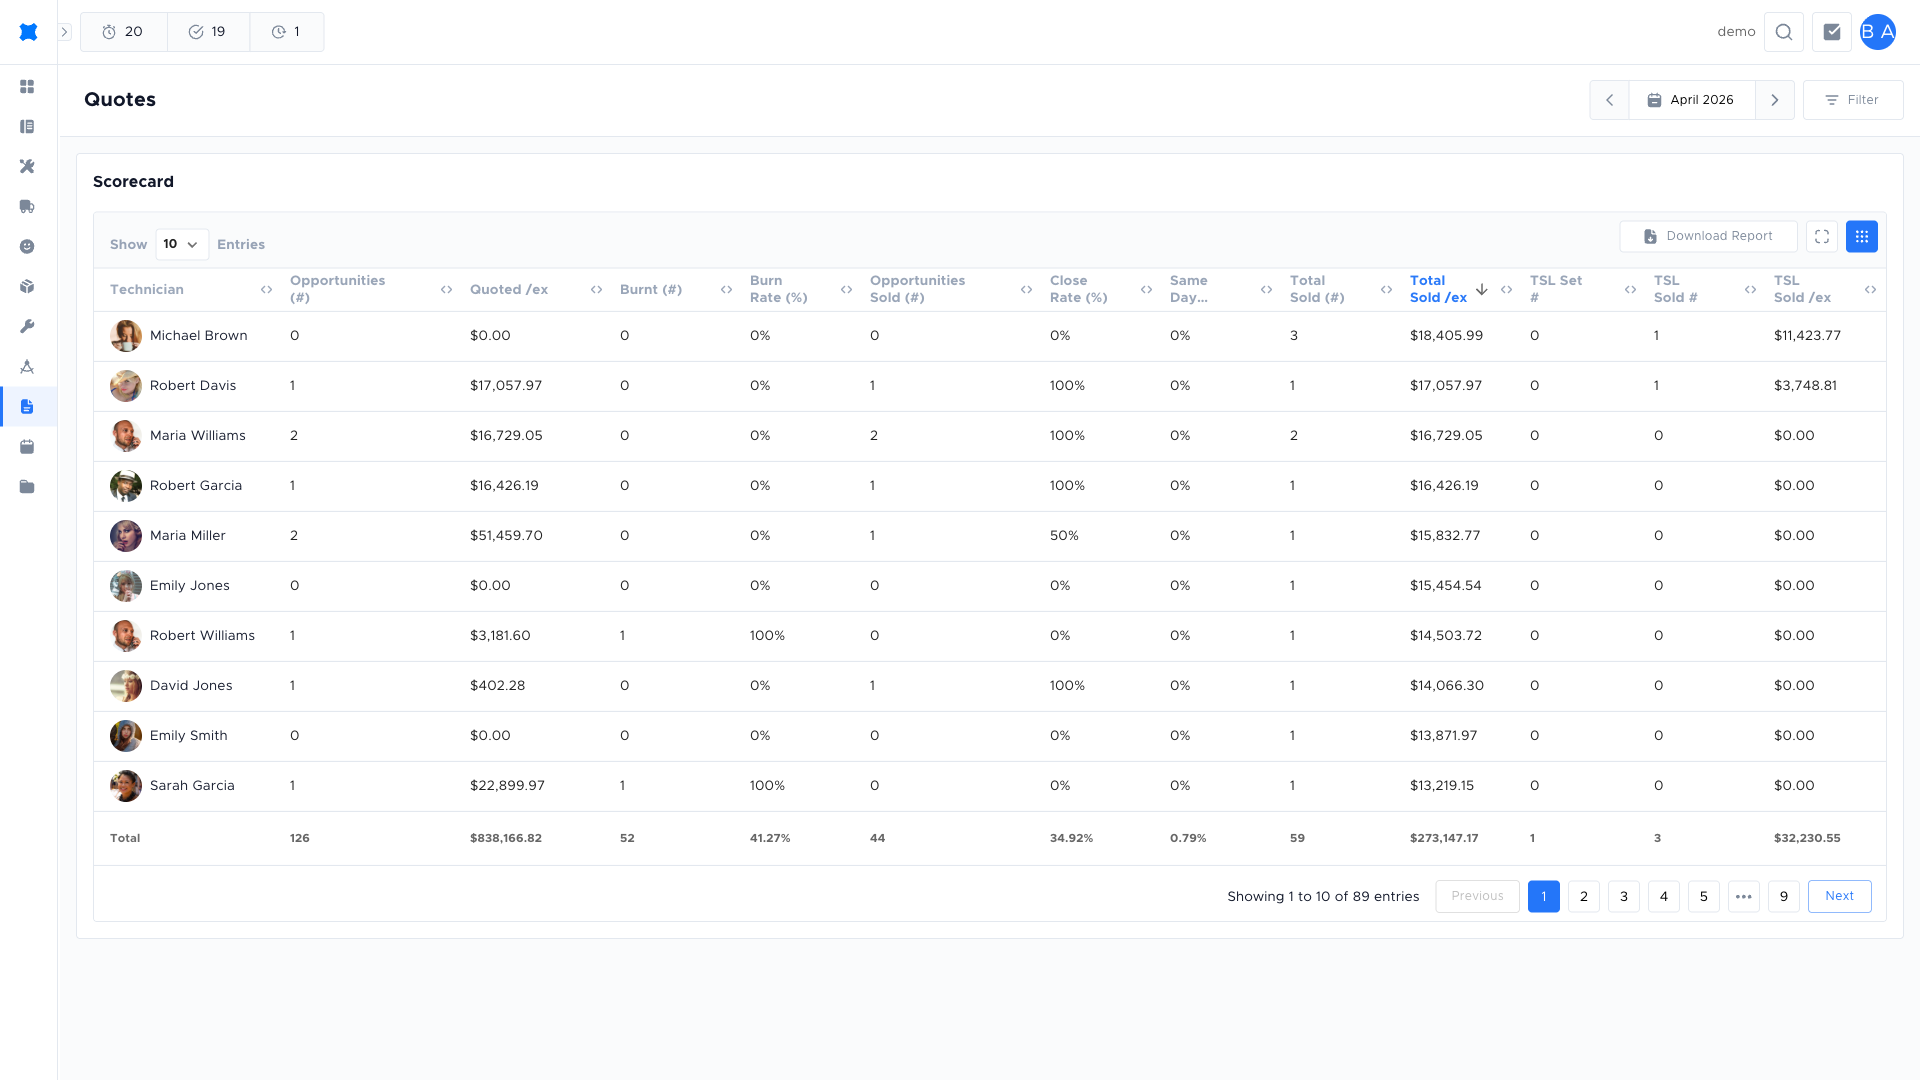
Section titled “Score card”The Score card (under Quotes in the sidebar) shows how you or your team are doing on quotes — for example:
- Quotes sent — Number of quotes sent in the selected period.
- Quotes approved — Number approved by the customer.
- Conversion or win rate — Often approval rate or value won.
- Follow-up metrics — e.g. average follow-ups per request, or per sale.
Use filters (date range, person, team) to see your own stats or, if you’re a manager, to review technician or team performance. The Score card helps track whether follow-up and quoting activity are turning into wins.
Dollar values in the CSV export are formatted to two decimal places so they open cleanly in spreadsheet tools without extra formatting.
Not-Unique requests
Section titled “Not-Unique requests”Requests marked as Not Unique (duplicates of another quote request — see Quote requests → Statuses) appear on the technician profile under their own column. They’re excluded from conversion-rate maths so duplicates don’t skew a technician’s numbers up or down.
Wallboard
Section titled “Wallboard”The Wallboard is a big-screen view of quote activity — useful in the office or workshop. It can show:
- Live counts — Quotes sent today, approved this week, etc.
- Recent activity — Latest sent or approved quotes.
- Goals — Target vs actual so the team can see progress.
Leave the Wallboard open on a shared screen so everyone can see how the team is tracking without opening the app.
Leaderboard
Section titled “Leaderboard”The Leaderboard ranks technicians (or teams) by quote-related metrics (e.g. quotes sent, approved, or value). It’s a quick way to see top performers and encourage healthy competition. You may be able to switch between time periods (e.g. this week, this month).
If you don’t see the Score card, Wallboard, or Leaderboard, your company may not have them enabled or your role may not have access. Ask your admin if you expect to see them.
Frequently asked questions
Section titled “Frequently asked questions”Why are some of my quotes not showing on the Score card?
Make sure the date range filter covers the period you want. Also check that the requests have a final status (Sold, Cancelled, or Rejected) — Open requests are still in progress and may be excluded depending on your workspace settings.
What does the “Not Unique” column mean on my technician profile?
Requests marked Not Unique are duplicates excluded from conversion-rate calculations. They appear in their own column so you can see the count without them distorting your win rate.
Can I see another technician’s Score card?
Managers with the right permissions can filter the Score card by person or team. If you cannot see others’ stats, ask your admin.
I don’t see the Wallboard — where is it?
The Wallboard may not be enabled for your workspace, or your role may not include access. Contact your admin.
Things to check
Section titled “Things to check”My stats seem lower than expected
Check the date range and status filters. The Score card counts only final-status requests (Sold, Cancelled, Rejected) within the selected date window. Open requests are still in progress and are excluded.
The Wallboard is not updating
The Wallboard refreshes on a timer. If it appears frozen, try reloading the page. Contact your admin if the issue persists.
Score card counts differ between my view and my manager’s
Different filter settings may produce different counts. Align the date range, status, and technician filters before comparing.