Dashboard Widgets
The Company Dashboard is made up of the following widgets. They can be reordered or hidden per workspace; this page describes each one at its default settings.
Summary Figures
Section titled “Summary Figures”Three headline numbers at the top of the board:
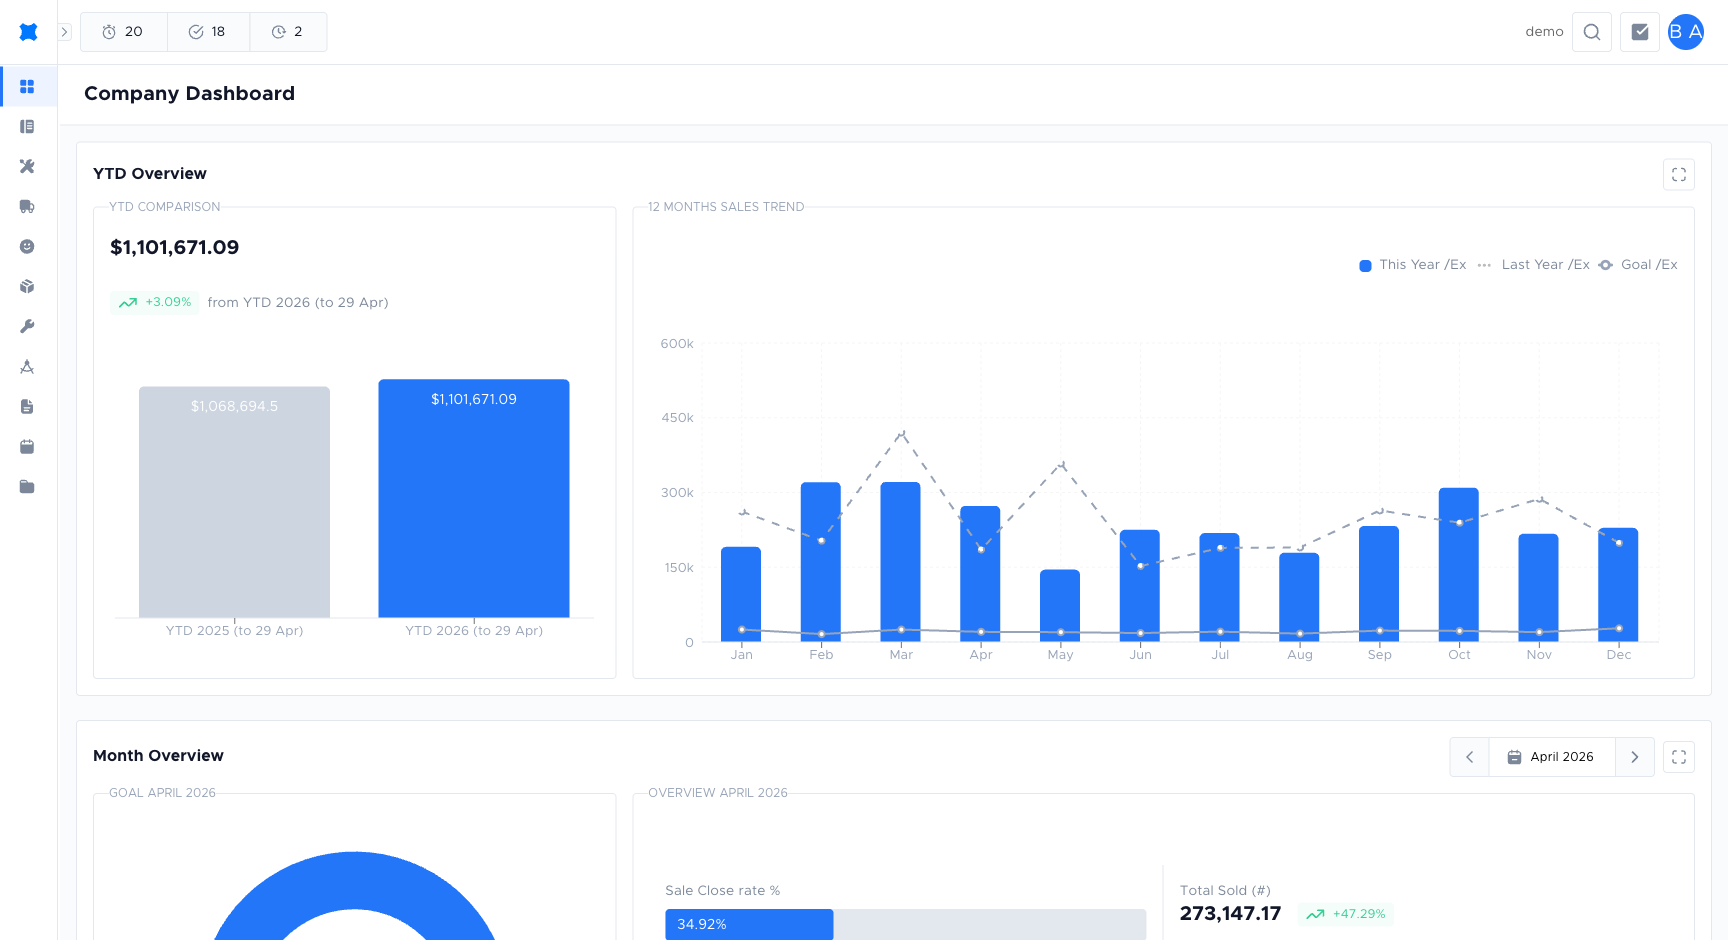
- Month Sold — total value of quote options approved this calendar month.
- YTD Sold — total approved from 1 January to today.
- Open Pipeline — value of quote options still sitting in non-final statuses (e.g. Sent, Pending).
Month Goal
Section titled “Month Goal”The Monthly Goal widget shows how close your workspace is to hitting the company-wide revenue target for the current month — the rolled-up total across every business unit. A progress chart fills as invoiced revenue increases. Once you reach or exceed the target, the chart reflects 100% or more.
Set or adjust each business unit’s contribution under Sales Goals. The bar resets at the start of each new month.
Month Sold Comparison
Section titled “Month Sold Comparison”Side-by-side view of this month’s sold value vs the same month last year, with a percentage change. Useful to spot seasonal swings at a glance.
YTD Sold Comparison
Section titled “YTD Sold Comparison”The same idea as Month Sold Comparison, but for calendar year to date vs the previous year.
Monthly Sold Trend
Section titled “Monthly Sold Trend”A 12-month rolling line/column chart of approved sold value. Makes it easy to see seasonality and whether the current month is ahead of trend.
Marketing Table Board
Section titled “Marketing Table Board”A table of lead sources (how the customer heard about you) with number of quotes, total sold, and conversion rate. Uses the lead source set on each quote request.
Dynamic Metrics Board
Section titled “Dynamic Metrics Board”A configurable tile board — each tile is a key performance indicator with a label, value, and colour band. Administrators pick the indicators and thresholds; dynamic metrics refresh on every dashboard tick.
Fixed Metrics Board
Section titled “Fixed Metrics Board”Similar to Dynamic Metrics but the tiles and their target values are fixed at setup time. Use this for “north-star” figures that should not move (e.g. quarterly goal, annual target).
Business Unit Sold Widget
Section titled “Business Unit Sold Widget”Breakdown of sold value by business unit. Each business unit shows its own progress and a small avatar/logo. Useful when one workspace runs multiple trades.
Leaderboard
Section titled “Leaderboard”A ranked table of team members by sold value this month, with avatars and an optional “since last week” change. Hovering a row shows the user’s conversion rate.
Things to check
Section titled “Things to check”A widget shows no data
The widget may require at least one quote or job to have been completed. Check that your workspace has the relevant records for the selected date range.
Monthly Goal widget shows 0%
No goal has been set for this month. See Sales Goals to configure one.